Note
Go to the end to download the full example code
scikit-learn model cards
This guide demonstrates how you can use this package to create a model card on a scikit-learn compatible model and save it.
Imports
First we will import everything required for the rest of this document.
import pickle
from pathlib import Path
from tempfile import mkdtemp, mkstemp

import pandas as pd
import sklearn
from sklearn.datasets import load_breast_cancer
from sklearn.ensemble import HistGradientBoostingClassifier
from sklearn.experimental import enable_halving_search_cv  # noqa
from sklearn.inspection import permutation_importance
from sklearn.metrics import (
    ConfusionMatrixDisplay,
    accuracy_score,
    classification_report,
    confusion_matrix,
    f1_score,
)
from sklearn.model_selection import HalvingGridSearchCV, train_test_split

from skops import hub_utils
from skops.card import Card, metadata_from_config
Data
We load breast cancer dataset from sklearn.
X, y = load_breast_cancer(as_frame=True, return_X_y=True)
X_train, X_test, y_train, y_test = train_test_split(
    X, y, test_size=0.3, random_state=42
)
print("X's summary: ", X.describe())
print("y's summary: ", y.describe())
X's summary:         mean radius  mean texture  ...  worst symmetry  worst fractal dimension
count   569.000000    569.000000  ...      569.000000               569.000000
mean     14.127292     19.289649  ...        0.290076                 0.083946
std       3.524049      4.301036  ...        0.061867                 0.018061
min       6.981000      9.710000  ...        0.156500                 0.055040
25%      11.700000     16.170000  ...        0.250400                 0.071460
50%      13.370000     18.840000  ...        0.282200                 0.080040
75%      15.780000     21.800000  ...        0.317900                 0.092080
max      28.110000     39.280000  ...        0.663800                 0.207500

[8 rows x 30 columns]
y's summary:  count    569.000000
mean       0.627417
std        0.483918
min        0.000000
25%        0.000000
50%        1.000000
75%        1.000000
max        1.000000
Name: target, dtype: float64
Train a Model
Using the above data, we train a model. To select the model, we use
HalvingGridSearchCV with a parameter grid
over HistGradientBoostingClassifier.
param_grid = {
    "max_leaf_nodes": [5, 10, 15],
    "max_depth": [2, 5, 10],
}

model = HalvingGridSearchCV(
    estimator=HistGradientBoostingClassifier(),
    param_grid=param_grid,
    random_state=42,
    n_jobs=-1,
).fit(X_train, y_train)
model.score(X_test, y_test)
0.9590643274853801
Initialize a repository to save our files in
We will now initialize a repository and save our model
_, pkl_name = mkstemp(prefix="skops-", suffix=".pkl")

with open(pkl_name, mode="bw") as f:
    pickle.dump(model, file=f)

local_repo = mkdtemp(prefix="skops-")

hub_utils.init(
    model=pkl_name,
    requirements=[f"scikit-learn={sklearn.__version__}"],
    dst=local_repo,
    task="tabular-classification",
    data=X_test,
)
Create a model card
We now create a model card, and populate its metadata with information which
is already provided in config.json, which itself is created by the call to
hub_utils.init() above. We will see below how we can populate the model
card with useful information.
model_card = Card(model, metadata=metadata_from_config(Path(local_repo)))
Add more information
So far, the model card does not tell viewers a lot about the model. Therefore, we add more information about the model, like a description and what its license is.
model_card.metadata.license = "mit"
limitations = "This model is not ready to be used in production."
model_description = (
    "This is a `HistGradientBoostingClassifier` model trained on breast cancer "
    "dataset. It's trained with `HalvingGridSearchCV`, with parameter grids on "
    "`max_leaf_nodes` and `max_depth`."
)
model_card_authors = "skops_user"
citation_bibtex = "**BibTeX**\n\n```\n@inproceedings{...,year={2020}}\n```"
model_card.add(
    **{
        "Citation": citation_bibtex,
        "Model Card Authors": model_card_authors,
        "Model description": model_description,
        "Model description/Intended uses & limitations": limitations,
    }
)
Add plots, metrics, and tables to our model card
Furthermore, to better understand the model performance, we should evaluate it
on certain metrics and add those evaluations to the model card. In this
particular example, we want to calculate the accuracy and the F1 score. We
calculate those using sklearn and then add them to the model card by calling
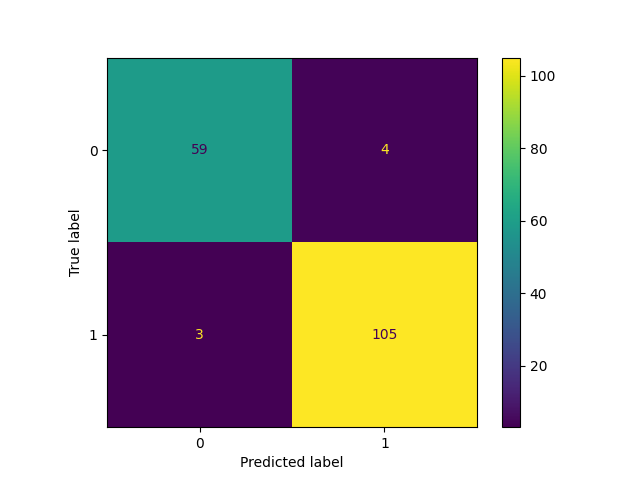
Card.add_metrics(). But this is not all, we can also add matplotlib
figures to the model card, e.g. a plot of the confusion matrix. To achieve
this, we create the plot using sklearn, save it locally, and then add it using
Card.add_plot() method. Finally, we can also add some useful tables to
the model card, e.g. the results from the grid search and the classification
report. Those can be added using Card.add_table()
y_pred = model.predict(X_test)
eval_descr = (
"The model is evaluated on test data using accuracy and F1-score with "
"macro average."
)
model_card.add(**{"Model description/Evaluation Results": eval_descr})
accuracy = accuracy_score(y_test, y_pred)
f1 = f1_score(y_test, y_pred, average="micro")
model_card.add_metrics(**{"accuracy": accuracy, "f1 score": f1})
cm = confusion_matrix(y_test, y_pred, labels=model.classes_)
disp = ConfusionMatrixDisplay(confusion_matrix=cm, display_labels=model.classes_)
disp.plot()
disp.figure_.savefig(Path(local_repo) / "confusion_matrix.png")
model_card.add_plot(
**{"Model description/Evaluation Results/Confusion Matrix": "confusion_matrix.png"}
)
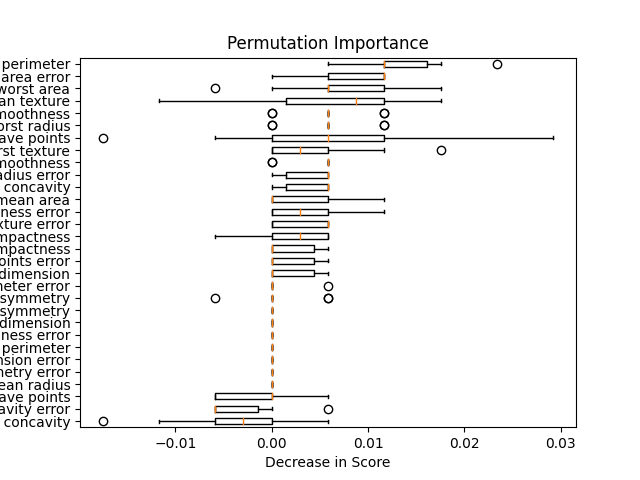
importances = permutation_importance(model, X_test, y_test, n_repeats=10)
model_card.add_permutation_importances(
importances,
X_test.columns,
plot_file=Path(local_repo) / "importance.png",
plot_name="Permutation Importance",
)
cv_results = model.cv_results_
clf_report = classification_report(
y_test, y_pred, output_dict=True, target_names=["malignant", "benign"]
)
# The classification report has to be transformed into a DataFrame first to have
# the correct format. This requires removing the "accuracy", which was added
# above anyway.
del clf_report["accuracy"]
clf_report = pd.DataFrame(clf_report).T.reset_index()
model_card.add_table(
folded=True,
**{
"Model description/Evaluation Results/Hyperparameter search results": (
cv_results
),
"Model description/Evaluation Results/Classification report": clf_report,
},
)
license: mit library_name: sklearn tags: - sklearn - skops - tabular-classification model_format: pickle model_file: skops-mwzox12s.pkl widget: structuredData: area error: - 30.29 - 96.05 - 48.31 compactness error: - 0.01911 - 0.01652 - 0.01484 concave points error: - 0.01037 - 0.0137 - 0.01093 concavity error: - 0.02701 - 0.02269 - 0.02813 fractal dimension error: - 0.003586 - 0.001698 - 0.002461 mean area: - 481.9 - 1130.0 - 748.9 mean compactness: - 0.1058 - 0.1029 - 0.1223 mean concave points: - 0.03821 - 0.07951 - 0.08087 mean concavity: - 0.08005 - 0.108 - 0.1466 mean fractal dimension: - 0.06373 - 0.05461 - 0.05796 mean perimeter: - 81.09 - 123.6 - 101.7 mean radius: - 12.47 - 18.94 - 15.46 mean smoothness: - 0.09965 - 0.09009 - 0.1092 mean symmetry: - 0.1925 - 0.1582 - 0.1931 mean texture: - 18.6 - 21.31 - 19.48 perimeter error: - 2.497 - 5.486 - 3.094 radius error: - 0.3961 - 0.7888 - 0.4743 smoothness error: - 0.006953 - 0.004444 - 0.00624 symmetry error: - 0.01782 - 0.01386 - 0.01397 texture error: - 1.044 - 0.7975 - 0.7859 worst area: - 677.9 - 1866.0 - 1156.0 worst compactness: - 0.2378 - 0.2336 - 0.2394 worst concave points: - 0.1015 - 0.1789 - 0.1514 worst concavity: - 0.2671 - 0.2687 - 0.3791 worst fractal dimension: - 0.0875 - 0.06589 - 0.08019 worst perimeter: - 96.05 - 165.9 - 124.9 worst radius: - 14.97 - 24.86 - 19.26 worst smoothness: - 0.1426 - 0.1193 - 0.1546 worst symmetry: - 0.3014 - 0.2551 - 0.2837 worst texture: - 24.64 - 26.58 - 26.0
Model description
This is a HistGradientBoostingClassifier model trained on breast cancer dataset. It's trained with HalvingGridSearchCV, with parameter grids on max_leaf_nodes and max_depth.
Intended uses & limitations
This model is not ready to be used in production.
Training Procedure
[More Information Needed]
Hyperparameters
Click to expand
| Hyperparameter | Value | |---------------------------------|----------------------------------------------------------| | aggressive_elimination | False | | cv | 5 | | error_score | nan | | estimator__categorical_features | | | estimator__class_weight | | | estimator__early_stopping | auto | | estimator__interaction_cst | | | estimator__l2_regularization | 0.0 | | estimator__learning_rate | 0.1 | | estimator__loss | log_loss | | estimator__max_bins | 255 | | estimator__max_depth | | | estimator__max_iter | 100 | | estimator__max_leaf_nodes | 31 | | estimator__min_samples_leaf | 20 | | estimator__monotonic_cst | | | estimator__n_iter_no_change | 10 | | estimator__random_state | | | estimator__scoring | loss | | estimator__tol | 1e-07 | | estimator__validation_fraction | 0.1 | | estimator__verbose | 0 | | estimator__warm_start | False | | estimator | HistGradientBoostingClassifier() | | factor | 3 | | max_resources | auto | | min_resources | exhaust | | n_jobs | -1 | | param_grid | {'max_leaf_nodes': [5, 10, 15], 'max_depth': [2, 5, 10]} | | random_state | 42 | | refit | True | | resource | n_samples | | return_train_score | True | | scoring | | | verbose | 0 |Model Plot
HalvingGridSearchCV(estimator=HistGradientBoostingClassifier(), n_jobs=-1,param_grid={'max_depth': [2, 5, 10],'max_leaf_nodes': [5, 10, 15]},random_state=42)In a Jupyter environment, please rerun this cell to show the HTML representation or trust the notebook. On GitHub, the HTML representation is unable to render, please try loading this page with nbviewer.org.
HalvingGridSearchCV(estimator=HistGradientBoostingClassifier(), n_jobs=-1,param_grid={'max_depth': [2, 5, 10],'max_leaf_nodes': [5, 10, 15]},random_state=42)HistGradientBoostingClassifier()
HistGradientBoostingClassifier()
Evaluation Results
| Metric | Value | |----------|----------| | accuracy | 0.959064 | | f1 score | 0.959064 |
Confusion Matrix

Model description/Evaluation Results/Hyperparameter search results
Click to expand
| iter | n_resources | mean_fit_time | std_fit_time | mean_score_time | std_score_time | param_max_depth | param_max_leaf_nodes | params | split0_test_score | split1_test_score | split2_test_score | split3_test_score | split4_test_score | mean_test_score | std_test_score | rank_test_score | split0_train_score | split1_train_score | split2_train_score | split3_train_score | split4_train_score | mean_train_score | std_train_score | |--------|---------------|-----------------|----------------|-------------------|------------------|-------------------|------------------------|-----------------------------------------|---------------------|---------------------|---------------------|---------------------|---------------------|-------------------|------------------|-------------------|----------------------|----------------------|----------------------|----------------------|----------------------|--------------------|-------------------| | 0 | 44 | 0.0342192 | 0.00164629 | 0.00584979 | 0.00129201 | 2 | 5 | {'max_depth': 2, 'max_leaf_nodes': 5} | 0.875 | 0.5 | 0.625 | 0.75 | 0.375 | 0.625 | 0.176777 | 5 | 0.628571 | 0.628571 | 0.628571 | 0.514286 | 0.514286 | 0.582857 | 0.0559883 | | 0 | 44 | 0.0405355 | 0.00629895 | 0.00562129 | 0.000647646 | 2 | 10 | {'max_depth': 2, 'max_leaf_nodes': 10} | 0.875 | 0.5 | 0.625 | 0.75 | 0.375 | 0.625 | 0.176777 | 5 | 0.628571 | 0.628571 | 0.628571 | 0.514286 | 0.514286 | 0.582857 | 0.0559883 | | 0 | 44 | 0.0342406 | 0.00326231 | 0.00570431 | 0.0006291 | 2 | 15 | {'max_depth': 2, 'max_leaf_nodes': 15} | 0.875 | 0.5 | 0.625 | 0.75 | 0.375 | 0.625 | 0.176777 | 5 | 0.628571 | 0.628571 | 0.628571 | 0.514286 | 0.514286 | 0.582857 | 0.0559883 | | 0 | 44 | 0.0336536 | 0.00112556 | 0.00530314 | 0.000230102 | 5 | 5 | {'max_depth': 5, 'max_leaf_nodes': 5} | 0.875 | 0.5 | 0.625 | 0.75 | 0.375 | 0.625 | 0.176777 | 5 | 0.628571 | 0.628571 | 0.628571 | 0.514286 | 0.514286 | 0.582857 | 0.0559883 | | 0 | 44 | 0.0339236 | 0.00198494 | 0.00530949 | 0.000126097 | 5 | 10 | {'max_depth': 5, 'max_leaf_nodes': 10} | 0.875 | 0.5 | 0.625 | 0.75 | 0.375 | 0.625 | 0.176777 | 5 | 0.628571 | 0.628571 | 0.628571 | 0.514286 | 0.514286 | 0.582857 | 0.0559883 | | 0 | 44 | 0.0333669 | 0.00123878 | 0.00525298 | 0.00016094 | 5 | 15 | {'max_depth': 5, 'max_leaf_nodes': 15} | 0.875 | 0.5 | 0.625 | 0.75 | 0.375 | 0.625 | 0.176777 | 5 | 0.628571 | 0.628571 | 0.628571 | 0.514286 | 0.514286 | 0.582857 | 0.0559883 | | 0 | 44 | 0.0330932 | 0.000180889 | 0.00532317 | 0.000144616 | 10 | 5 | {'max_depth': 10, 'max_leaf_nodes': 5} | 0.875 | 0.5 | 0.625 | 0.75 | 0.375 | 0.625 | 0.176777 | 5 | 0.628571 | 0.628571 | 0.628571 | 0.514286 | 0.514286 | 0.582857 | 0.0559883 | | 0 | 44 | 0.0334374 | 0.000740412 | 0.00533118 | 0.000100206 | 10 | 10 | {'max_depth': 10, 'max_leaf_nodes': 10} | 0.875 | 0.5 | 0.625 | 0.75 | 0.375 | 0.625 | 0.176777 | 5 | 0.628571 | 0.628571 | 0.628571 | 0.514286 | 0.514286 | 0.582857 | 0.0559883 | | 0 | 44 | 0.0330923 | 0.000766732 | 0.00514064 | 0.000456063 | 10 | 15 | {'max_depth': 10, 'max_leaf_nodes': 15} | 0.875 | 0.5 | 0.625 | 0.75 | 0.375 | 0.625 | 0.176777 | 5 | 0.628571 | 0.628571 | 0.628571 | 0.514286 | 0.514286 | 0.582857 | 0.0559883 | | 1 | 132 | 0.0994816 | 0.00136736 | 0.00586047 | 0.000119536 | 10 | 5 | {'max_depth': 10, 'max_leaf_nodes': 5} | 0.961538 | 0.923077 | 0.923077 | 0.961538 | 0.961538 | 0.946154 | 0.0188422 | 2 | 1 | 1 | 1 | 1 | 1 | 1 | 0 | | 1 | 132 | 0.100828 | 0.00223632 | 0.00591097 | 0.00011043 | 10 | 10 | {'max_depth': 10, 'max_leaf_nodes': 10} | 0.961538 | 0.923077 | 0.923077 | 0.961538 | 0.961538 | 0.946154 | 0.0188422 | 2 | 1 | 1 | 1 | 1 | 1 | 1 | 0 | | 1 | 132 | 0.0938686 | 0.0123516 | 0.00536861 | 0.0011367 | 10 | 15 | {'max_depth': 10, 'max_leaf_nodes': 15} | 0.961538 | 0.923077 | 0.923077 | 0.961538 | 0.961538 | 0.946154 | 0.0188422 | 2 | 1 | 1 | 1 | 1 | 1 | 1 | 0 | | 2 | 396 | 0.29167 | 0.0530455 | 0.00582457 | 0.00107057 | 10 | 15 | {'max_depth': 10, 'max_leaf_nodes': 15} | 0.962025 | 0.911392 | 0.987342 | 0.974359 | 0.935897 | 0.954203 | 0.0273257 | 1 | 1 | 1 | 1 | 1 | 1 | 1 | 0 |Model description/Evaluation Results/Classification report
Click to expand
| index | precision | recall | f1-score | support | |--------------|-------------|----------|------------|-----------| | malignant | 0.951613 | 0.936508 | 0.944 | 63 | | benign | 0.963303 | 0.972222 | 0.967742 | 108 | | macro avg | 0.957458 | 0.954365 | 0.955871 | 171 | | weighted avg | 0.958996 | 0.959064 | 0.958995 | 171 |How to Get Started with the Model
[More Information Needed]
Model Card Authors
skops_user
Model Card Contact
You can contact the model card authors through following channels: [More Information Needed]
Citation
BibTeX
@inproceedings{...,year={2020}}
Permutation Importance

Save model card
We can simply save our model card by providing a path to Card.save().
model_card.save(Path(local_repo) / "README.md")
Total running time of the script: ( 0 minutes 5.574 seconds)